View Analysis views (also referred to as summary views) provide summary statistical data presented as one-dimensional or two-dimensional reports. You generate these reports using the Analysis commands from a grid view. If the view is a parent-child grid view, the Analysis commands work on the parent grid view.
Analysis views use the sort fields as their dimensions, either the default sort fields in the view definition, or sort fields that you select.These reports display the sort fields that you have specified for the view, a count column, and the total.
Count and sum are provided for numeric fields that are not primary or foreign keys.
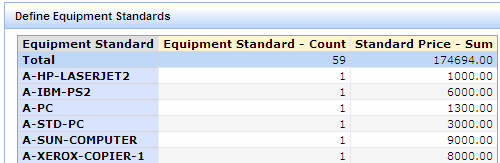
The following shows a one-dimensional list report sorted by equipment standard and showing the count and total for each standard and the standard price.
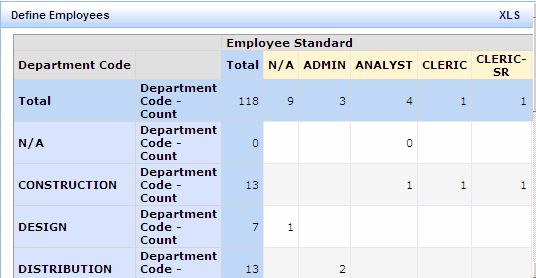
The following shows a two-dimensional report sorted by department and employee standard.
To create a view analysis report:
The resulting analysis view is calculated on the server and shown in a dialog over the source view.
You can export the data to Excel or you can print the report using the Print icon.