Utilization reports provide a broad picture of how your space is utilized. The Hoteling application offers reports on overall space utilization, as well as utilization of only hotelable rooms. Although both these sets of reports indicate space utilization, they examine different sets of data to do so.
These reports answer such questions as: how often are my seats being occupied? do I have too many hotelable rooms? are my seats often empty? which departments are using the most permanent and hotelable space?
Perhaps your company should set a goal of the desired utilization rate. If you are consistently meeting this rate, you have the correct number of rooms designated as hotelable. If you are consistently coming in well below your target rate, perhaps you have too many hotelable rooms. These rooms could be permanently assigned to departments or assigned to other uses. Or, perhaps you should consider reducing your space.
These reports base their calculations on the allocated area field of the Rooms table, which is updated when the user provides a date range and runs updates area totals. The calculations include all rooms, not just those that are hotelable (although you can set an option to include only hotelable rooms).
Room utilization is calculated as: Allocated Area/Room Area for each room. (rm.area_alloc/rm.area_rm). Department utilization sums this data by department.
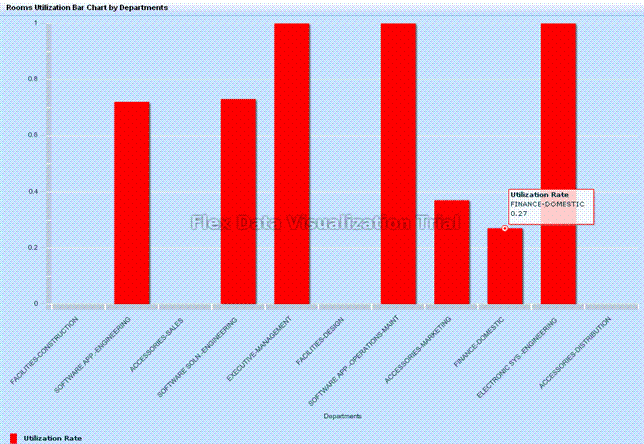
Note: The Overall Utilization by Building report operates a bit differently than the department and room reports. In addition to mousing over a bar to get details, you can drill down on the bar to get the component details. For example, when you click on a bar in the Buildings chart,the system presents a second Web Central window a bar chart of the floors in this building. Click on a floor bar, and the system presents a third window with a bar chart of the room information.
Note the following about the below sample bar chart for room utilization by department:

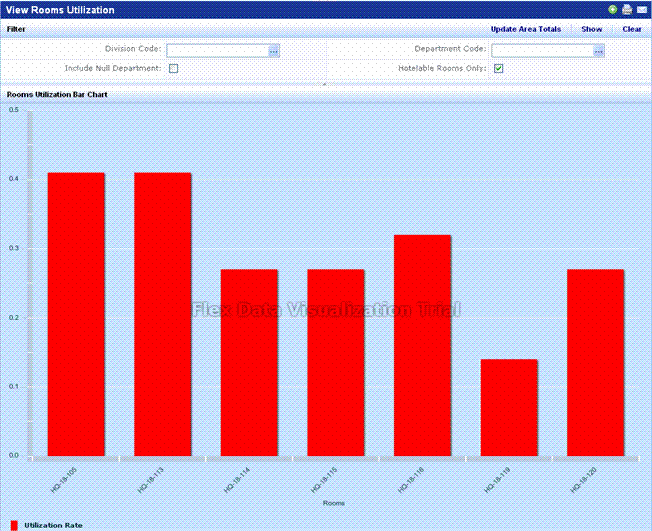
The Overall Utilization by Room report presents a similar bar chart, except that the X axis presents each room. You cannot double-click on a bar to show further details, as the bar is representing only one room; however, you can mouse over the bar for details. If you have a lot of rooms, you may wish to set a filter so that there are not too many bars, which become difficult to read. For example, the below image shows the utilization rate of hotelable rooms only.

The Overall Utilization by Building report operates a bit differently than the above two reports. When you click on a bar in the Buildings chart, the system presents a second Web Central window with the Floor chart. Click on a floor bar, and the system presents a third window with the room information.
Whereas the overall utilization reports reflect your complete inventory, the hoteled utilization reports show the utilization of only hoteled rooms that have at least one booking. These reports do not consider empty rooms. Use these reports to determine how often your hoteled rooms, that are booked at least once, are being used.
Room utilization is calculated by dividing the available seat-days per month by the used seat-days per month, for a group of bookings for a room, or a group of bookings for a department. The utilization calculations must first calculate the following:
rm.cap_em – rm.count_em for hotelable roomsHoteled utilization compares the time that a room is available during a month to the total time that the room was booked in that month.
Run this report and you are prompted for a calendar year for which to examine utilization. You can also limit the report to use bookings of a certain department or located within a certain building or floor. For each month, the report lists the rate that each hotelable room was used. For example,if a room has three available seats, the seats were booked all day, and the bookings included weekends, the utilization rate for the room would be 1.00.
Hoteled utilization by Department is similar to the above report except that it shows the sum of all times a department’s rooms were booked in a month, divided by the sum of all a department’s room availability in that month.