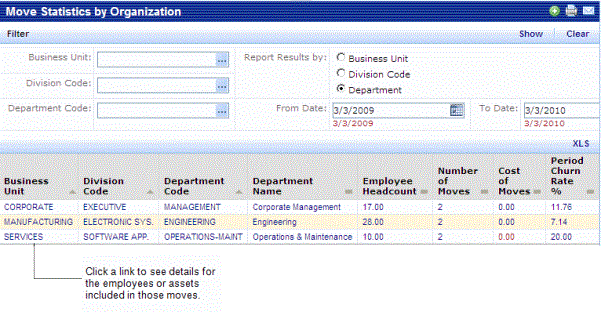
The ARCHIBUS Move Management application provides you with a variety of Move Statistics reports and charts for managing and analyzing enterprise moves. The reports include a filter console so that you can select the statistics, time period, location, or organizational unit to report on.
Each Move Statistics Report is a View Analysis view with clickable links. When you click on a link in a report, a new window opens that displays details for the personnel and assets being moved.
Note: Move Statistic reports are generated only for move projects that have the status of Closed. See Completing a Move.

Note: Churn rate is calculated for employees moving to a new location. Churn rate does not include employees leaving or new hires.
Note: The Windows Client/Server product also offers move features. Web Central churn reports require that the Employee Code of the Move Order be completed; this is not required in Windows Client/Server. Therefore, if you mix Windows Client/Server and Web Central Move Management data, your Web Central churn reports may not reflect room-only moves made from Windows Client/Server.
You can generate a number of reports that are based on the churn rate. The churn rate is calculated as the percentage ratio of the number of employee moves completed over a specified time period divided by the average number of occupants during that same time period.
For example, if 150 employees were involved in moves over the past 12 months and the average number of employees during the past year is 1000, then the Churn Rate is 15%.
Churn rate uses the Move Date field to determine if a move record falls within the period for which churn is being calculated.
Churn rate can be calculated for:
To provide accurate churn rate calculations, Web Central calculates monthly headcounts by building and department and stores this historical headcount data in the hist-em_count table. This table is populated on the first day of each month using a scheduled workflow rule.
This monthly headcount is used to calculate the average headcount for the time period reported on.
The headcount for both months with moves and months without moves is included when calculating the headcount average for the time period being reported on.
The monthly headcount includes employees who are assigned to:
This ensures that the headcount accurately reflects the number of employees by building or division. For example, an employee who is assigned to the Sales Department might not be assigned to a specific room in a building, but this employee is included in the headcount by division as they are part of the Sales Department.
How the headcount is calculated if you did not occupy the building for the entire time period being reported on: In this case,the headcount for the non-occupying months is not computed as part of the average. For example, if you move into a new building in May and have 300 employees, then in June you have 310 employees and you move 30 employees. The overall churn for this quarter would be the number of moves (30) divided by the average headcount for the two months (305). The months without data are not included.
When generating move statistics reports and charts, you can use the Filter console to specify the time period for the report and, depending on the report, the organization or location information for the report.Each report includes default selections in the Filter console that are used when you first select the report task. .
By default, the Filter console is set to generate the report for the past 12 months.If you do not enter a To Date for the report's time period, by default, the current date is used.
When you select a field to restrict by, this might disable other selections on the Filter console. For example, if you select to generate the report for specific building, you can then report results by only building; the country, region, state, city, and site grouping selections are no longer relevant.
From the Filter console, you can make the following selections when generating reports:
Note: The time period used to generate the report must include the time period selected for the Chart Results by selection. For example, if you select to Chart Results by Year, then you must generate the report for at least one year.
You can generate the following move statistics reports and charts. These reports are based on data for move projects that have the Status of Completed.
For example, if you select a Site, a From Date and To Date, set the Chart Statistic to Number of Moves, the Report Results by to Building, and the Chart Results by to Month, the chart draws one line for each building on the selected site representing the variation in the number of moves from month to month.
For example, if you select a Business Unit, a From and To Date, set the Chart Statistic to Number of Moves, the Report Results by to Division, and the Chart Results by to Month, the chart draws one line for each division for the selected business unit, representing the variation in the number of moves from month to month.