Whether or a room is at capacity or can accept more employees depends on the following factors:
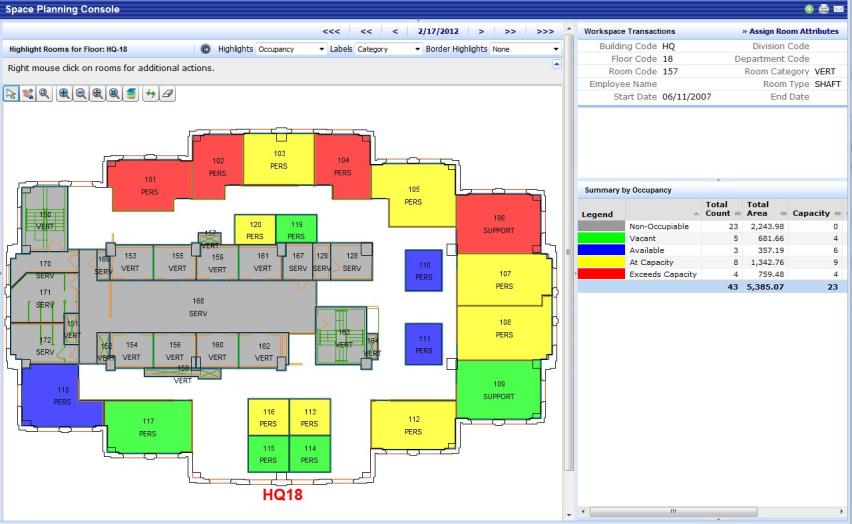
Some reports and tasks highlight rooms by their occupancy status, using a different highlight color for each occupancy status. The following occupancy statuses are available:
If you are a user that has access to the Space Manager process, your drawing will display rooms that are over capacity and at capacity. As a space manager working with move requests, you can assign employees to over-capacity and at-capacity rooms and then make adjustments as needed. For example, if you have no availability, you can set up a temporary workspace in an at-capacity room by setting up a table and chair. As you reconfigure and more space opens up, you can re-assign people and move them from the over-capacity rooms as needed. At any time, you can use the Workspace Transaction Exceptions report to locate over-capacity rooms.
If you are not a space manager, your drawing will indicate only available and vacant rooms for tasks involving assigning employees to rooms. Because you likely do not have a complete picture of space needs and do not manage the space occupancy system, you cannot assign employees to over-capacity and at-capacity rooms.
Occupancy Count in reports and occupancy count for the move request process consider slightly different factors:
| Feature | Occupancy Count is Based On |
| Reports and Space Planning Console |
|
| Move Request Process |
|
Considering workspace transactions from both requested (pending) and approved service requests as of the move date avoids conflicts for the move request process. For example, suppose the following:
If occupancy count did not consider the move date and pending requests, Room 101 would show as At Capacity on January 15, when in fact it would be available for Employee B.
Tip:Since the Space Planning Console considers approved requests only and does not consider requested move requests, you may wish to set the Border Highlight to Pending Requests so that you can see rooms that may change when pending move requests are approved.
The system determines the following:
Since Occupancy Count can change throughout a period, Occupancy Count and Occupancy Rate can be reported for a singular date or a date range, depending on how you run Update Area Totals.
For example, suppose room 101, with a capacity of 2, has two occupants during first half of January and one occupant during second half of January. You would obtain the following values on these dates and date ranges:
| Update Area Total is Run For | Occupancy Count | Capacity | Occupancy Rate |
| January 1 to January 1 | 2 | 2 | 100 percent |
| January 31 to January 31 | 1 | 2 | 50 percent |
| January 1 to January 31 | 1.5 | 2 | 75 percent |